Modeler App
Modeler is a webapp for designing and running studyflow diagrams. Its drag-and-drop interface helps you to visually define every step of your study, from initial conception, subject recruitment, data collection, and analysis pipelines to final reporting.
Key features
- Drag-and-drop interface.
- Predefined node types for common research elements (e.g., cognitive tests, video games, questionnaires, and instructions).
- Export studyflow diagrams as BPMN 2.0 XML, PNG, or SVG.
- Integration with Behaverse Data Server to execute diagrams directly from the modeler.
- Simulation mode to test and debug diagrams.
Creating a diagram
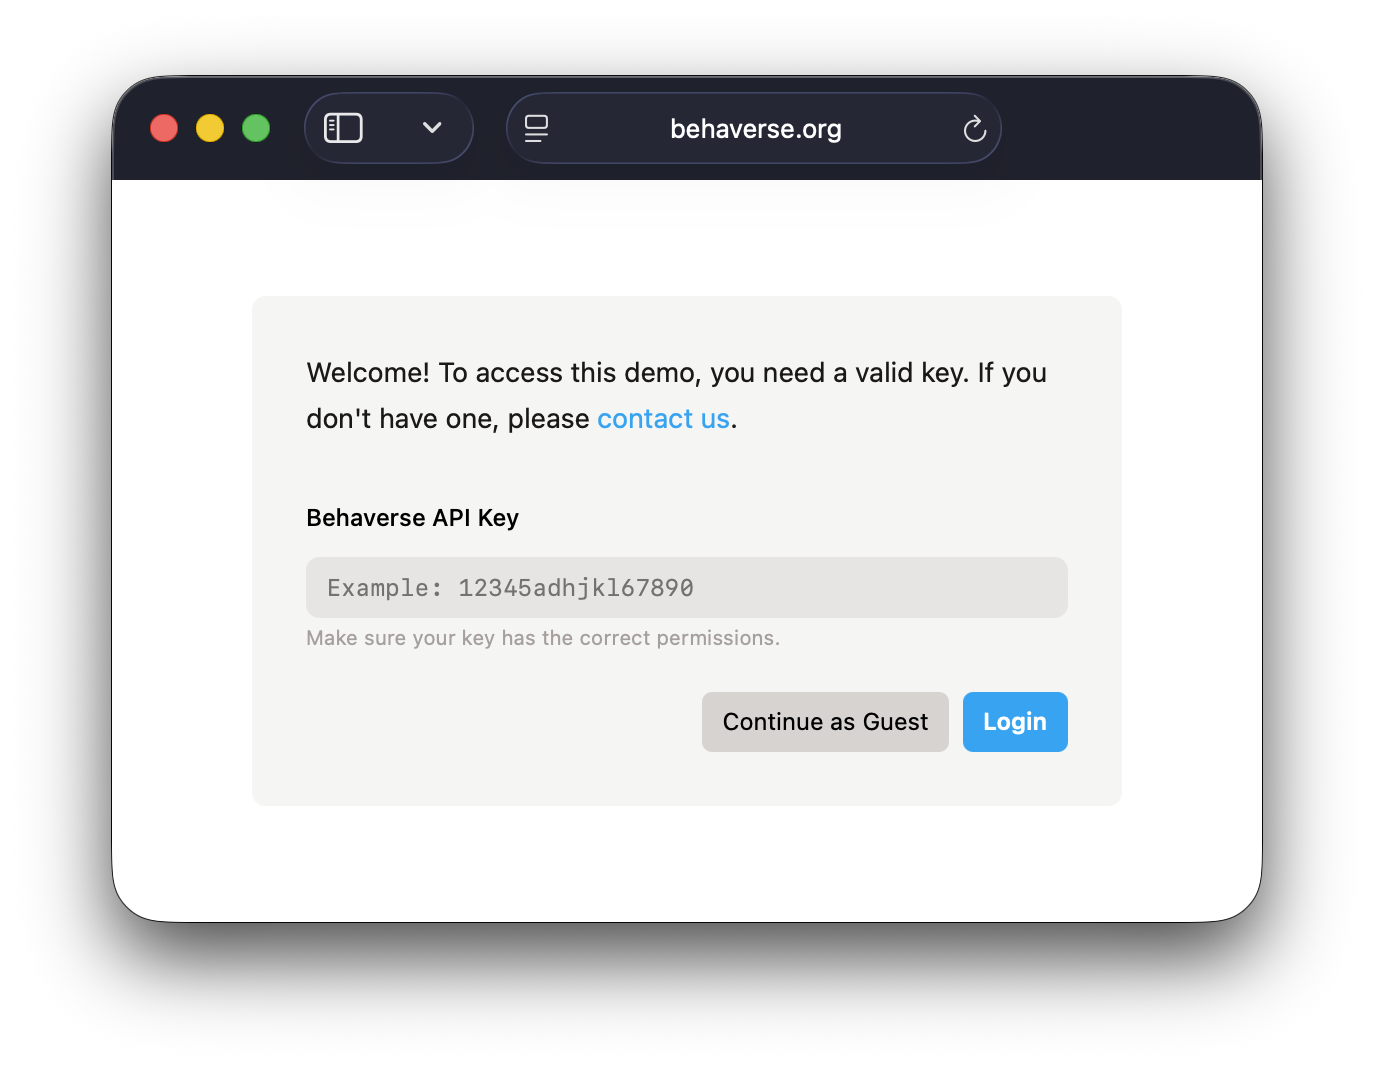
Open the Modeler app in your web browser.
Enter your Behaverse API key and click Login to access additional features, or click Continue as guest to use the app in guest mode. The only limitation is that you cannot publish studies to the Behaverse Data Server.
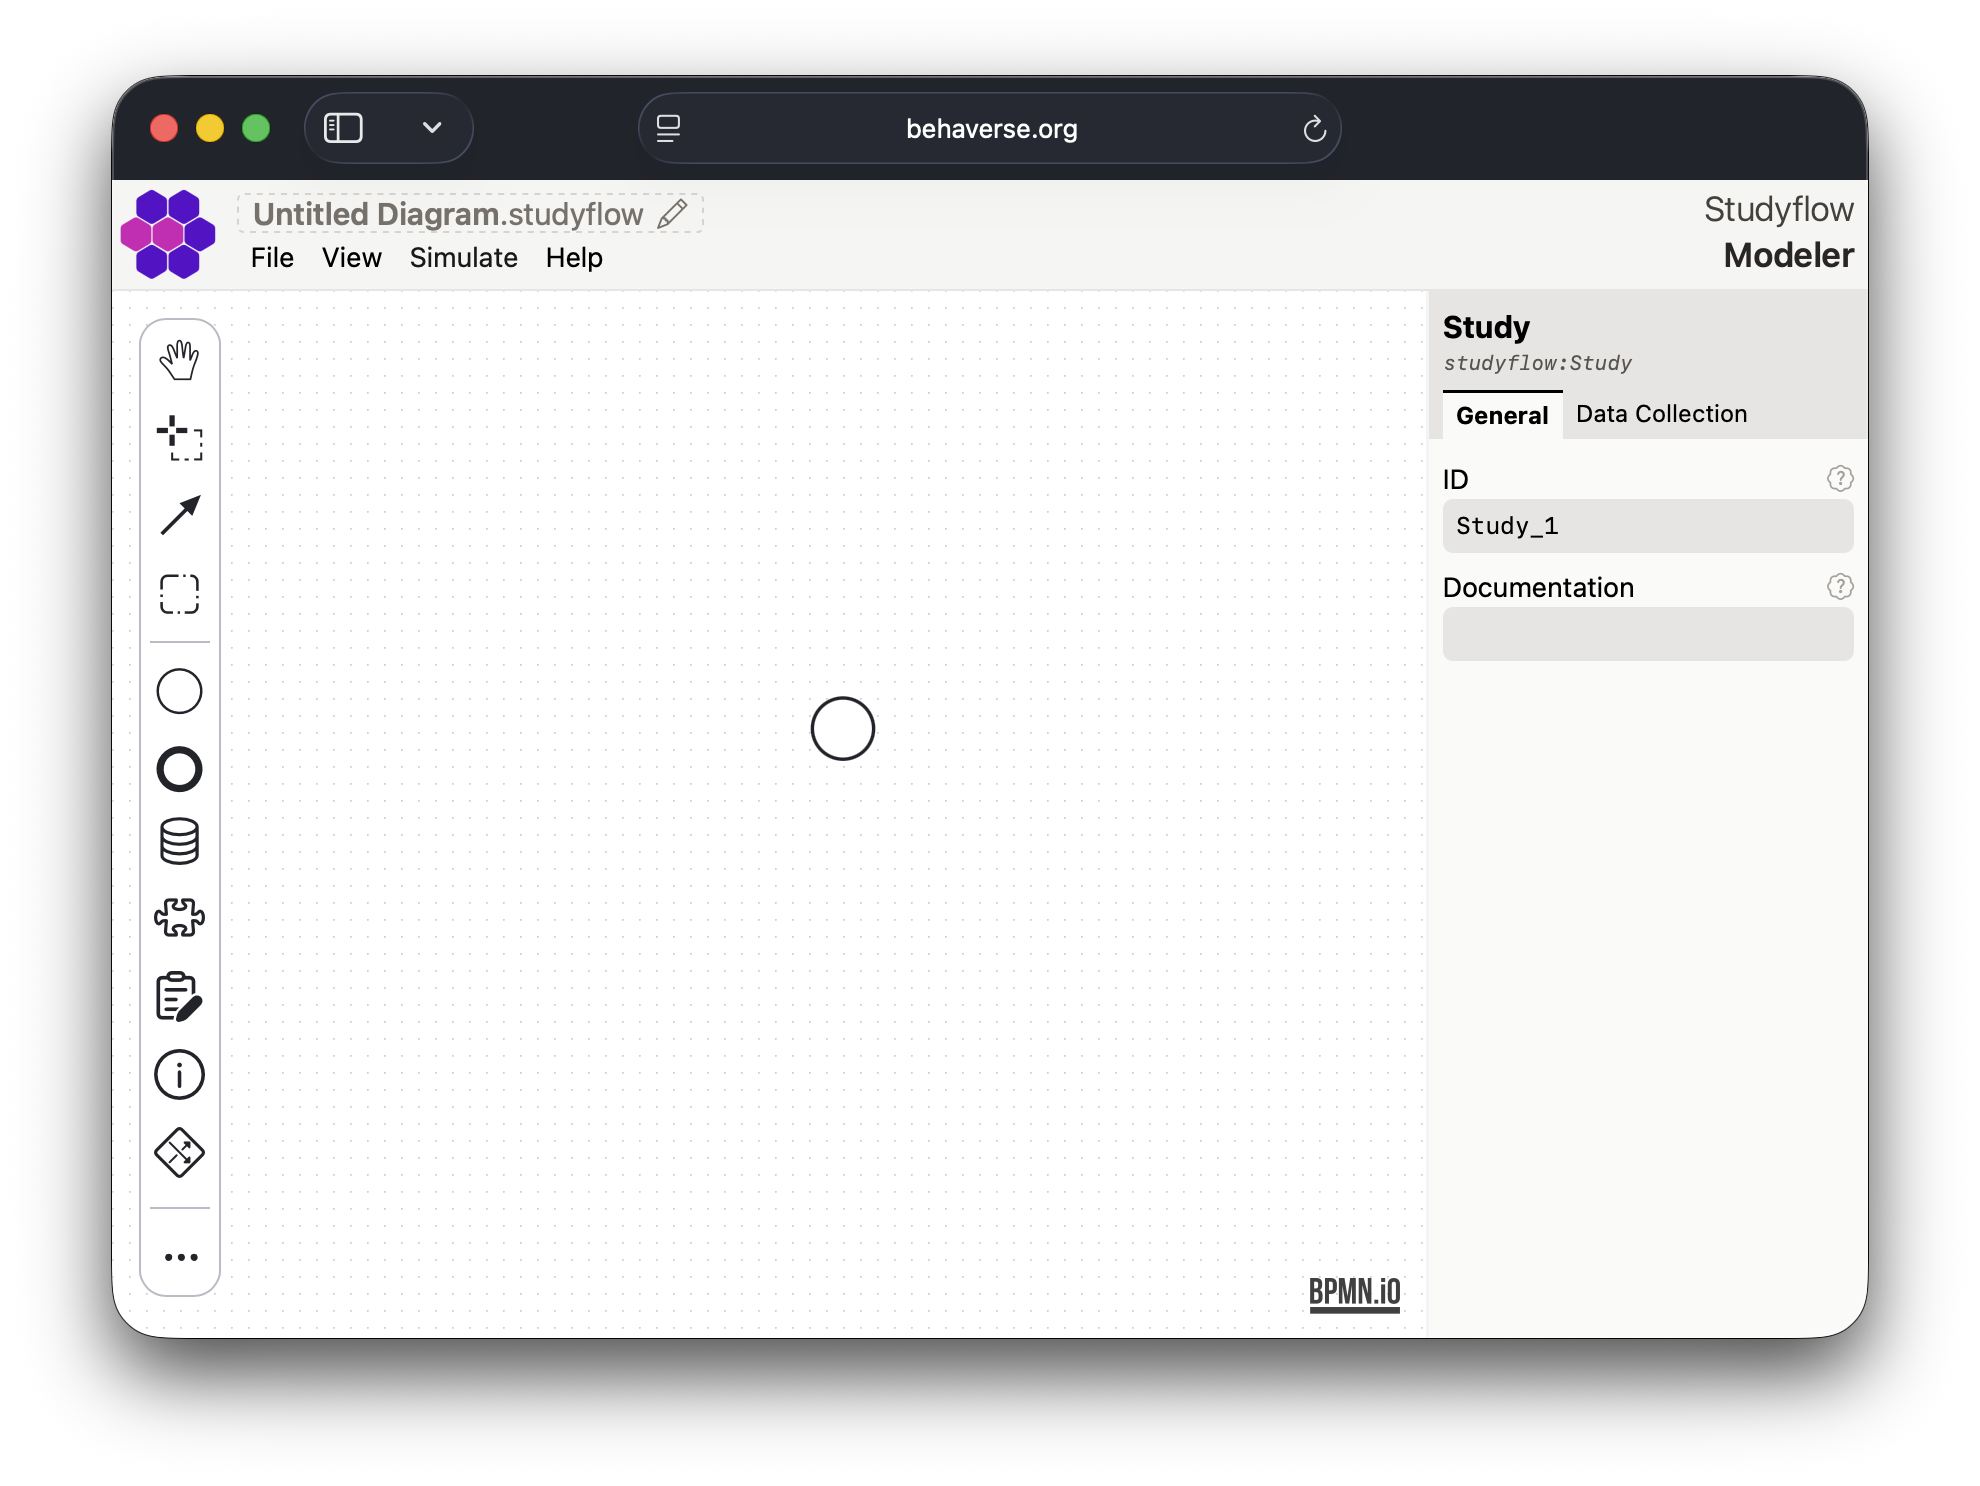
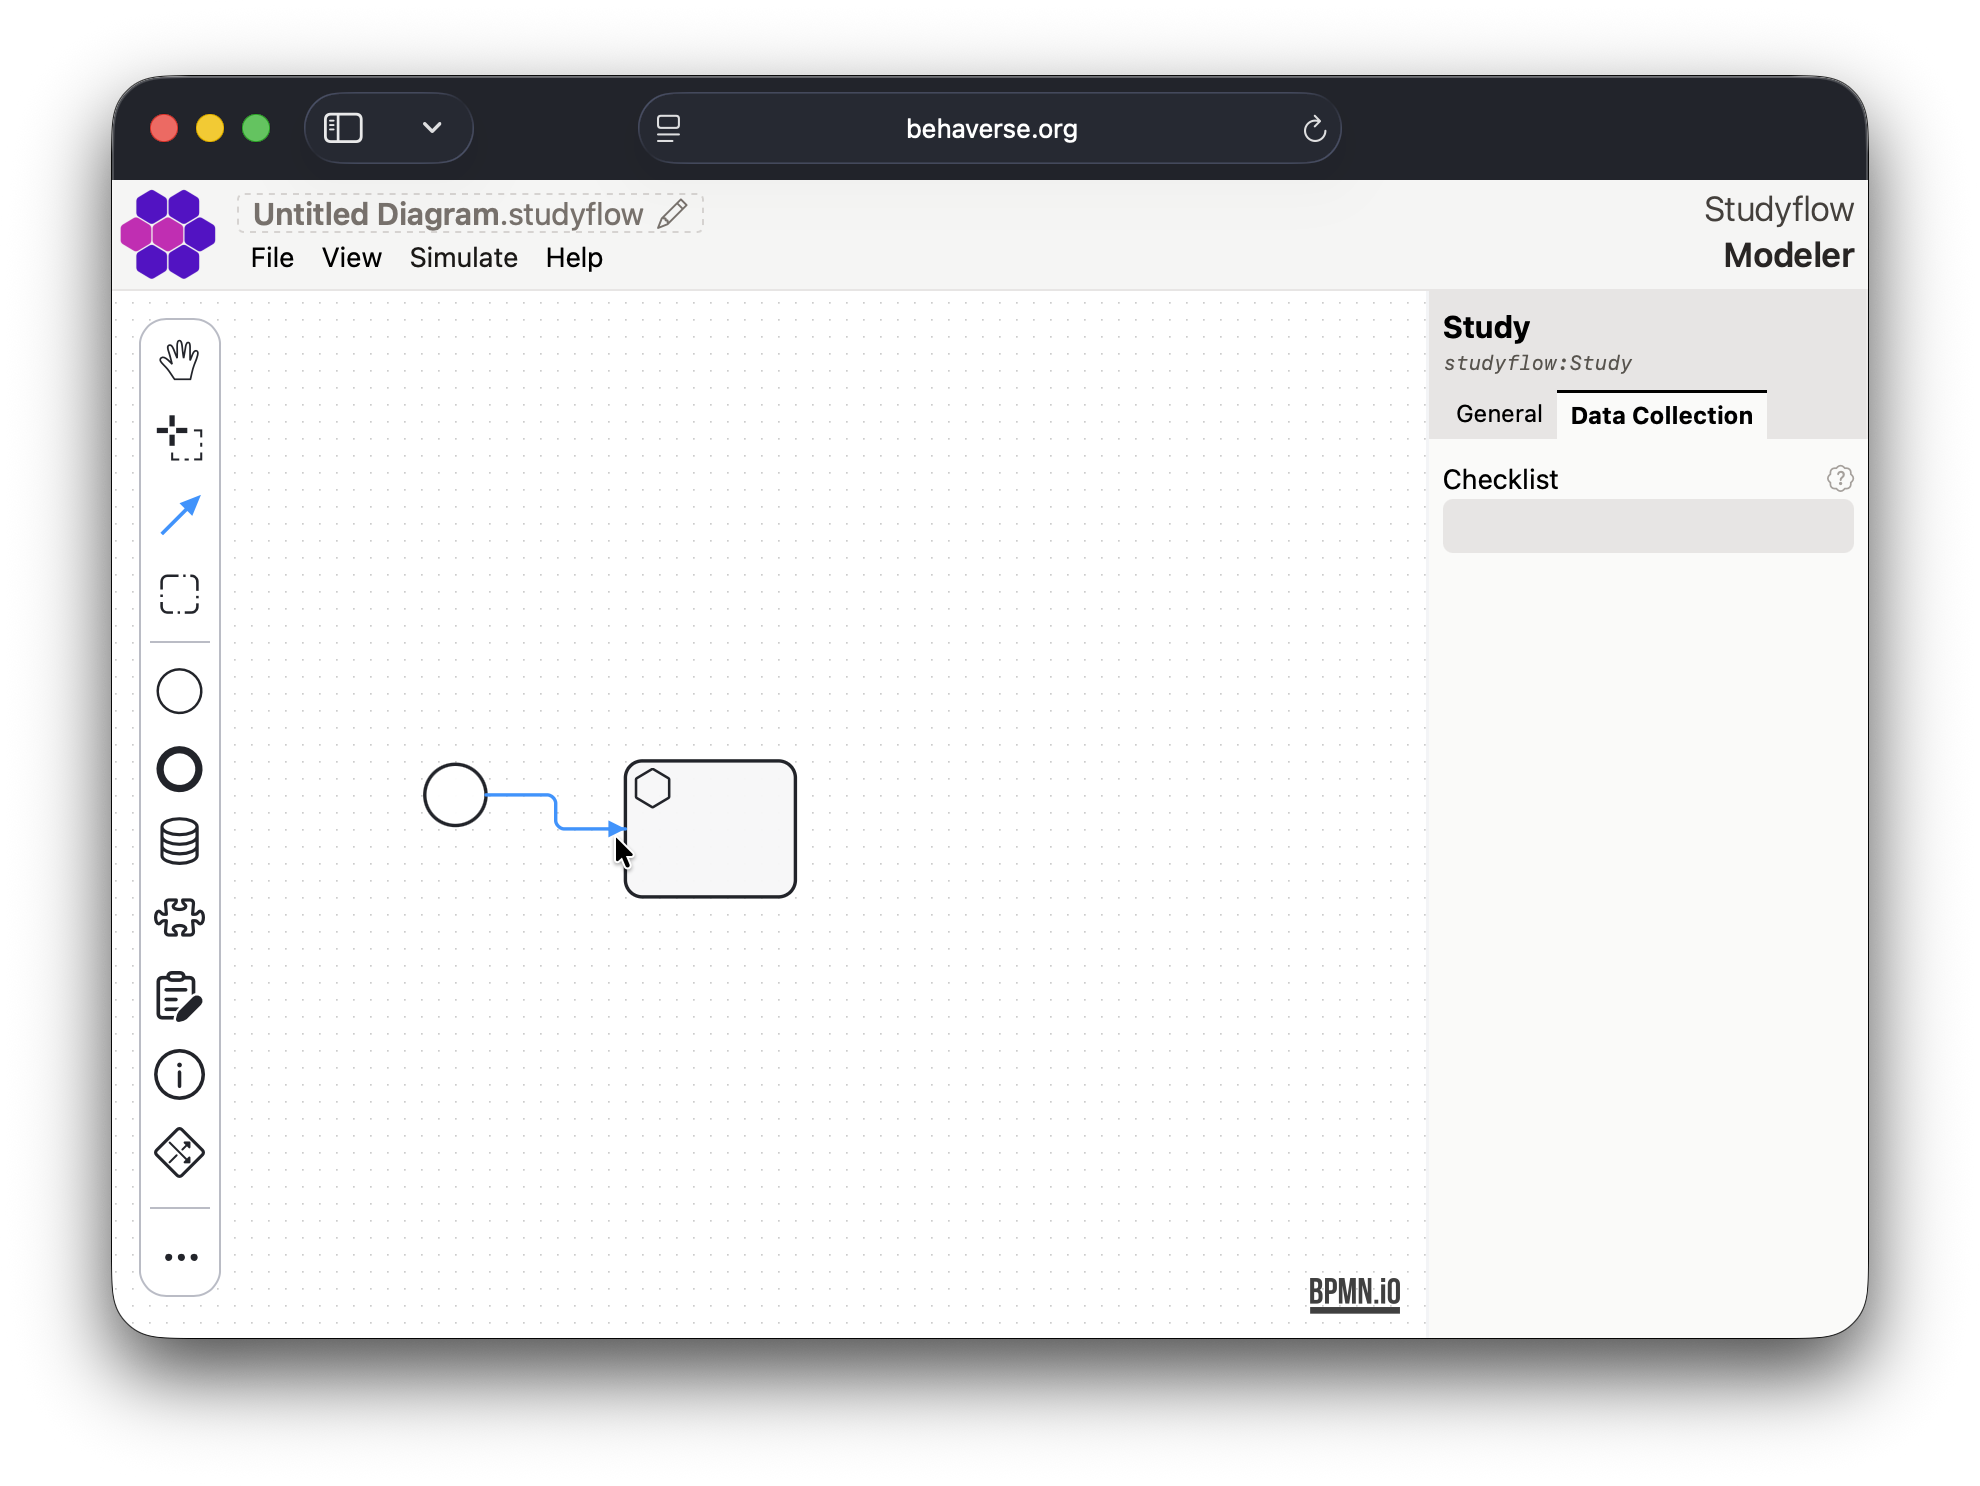
- Use the left palette to drag and drop elements onto the canvas.
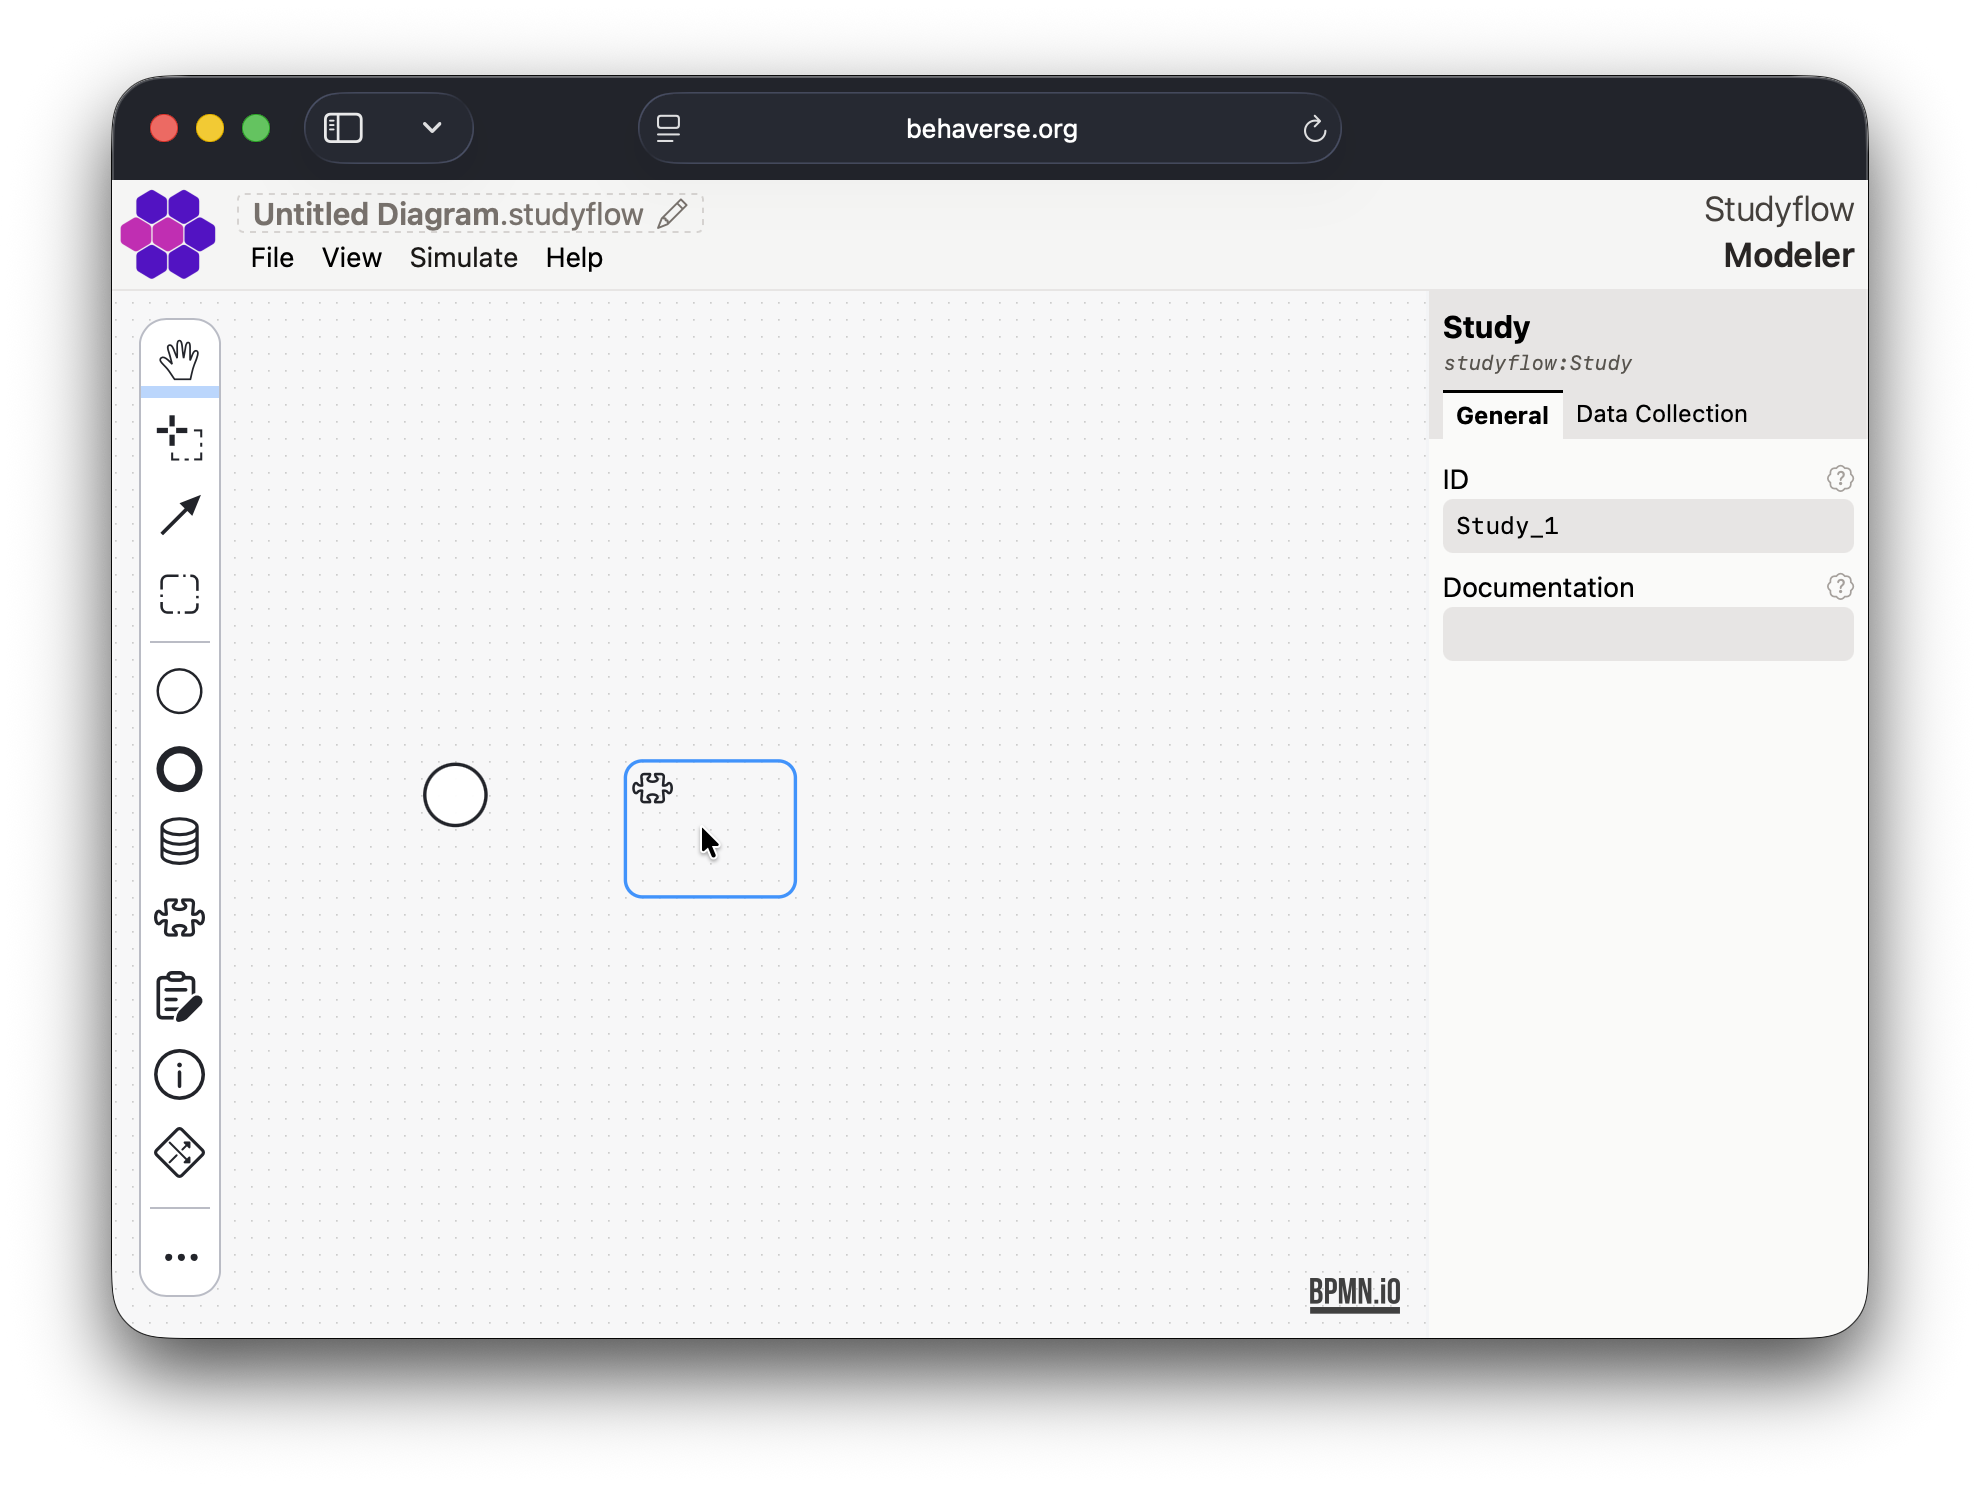
- Select an element to configure its properties in the right inspector sidebar.
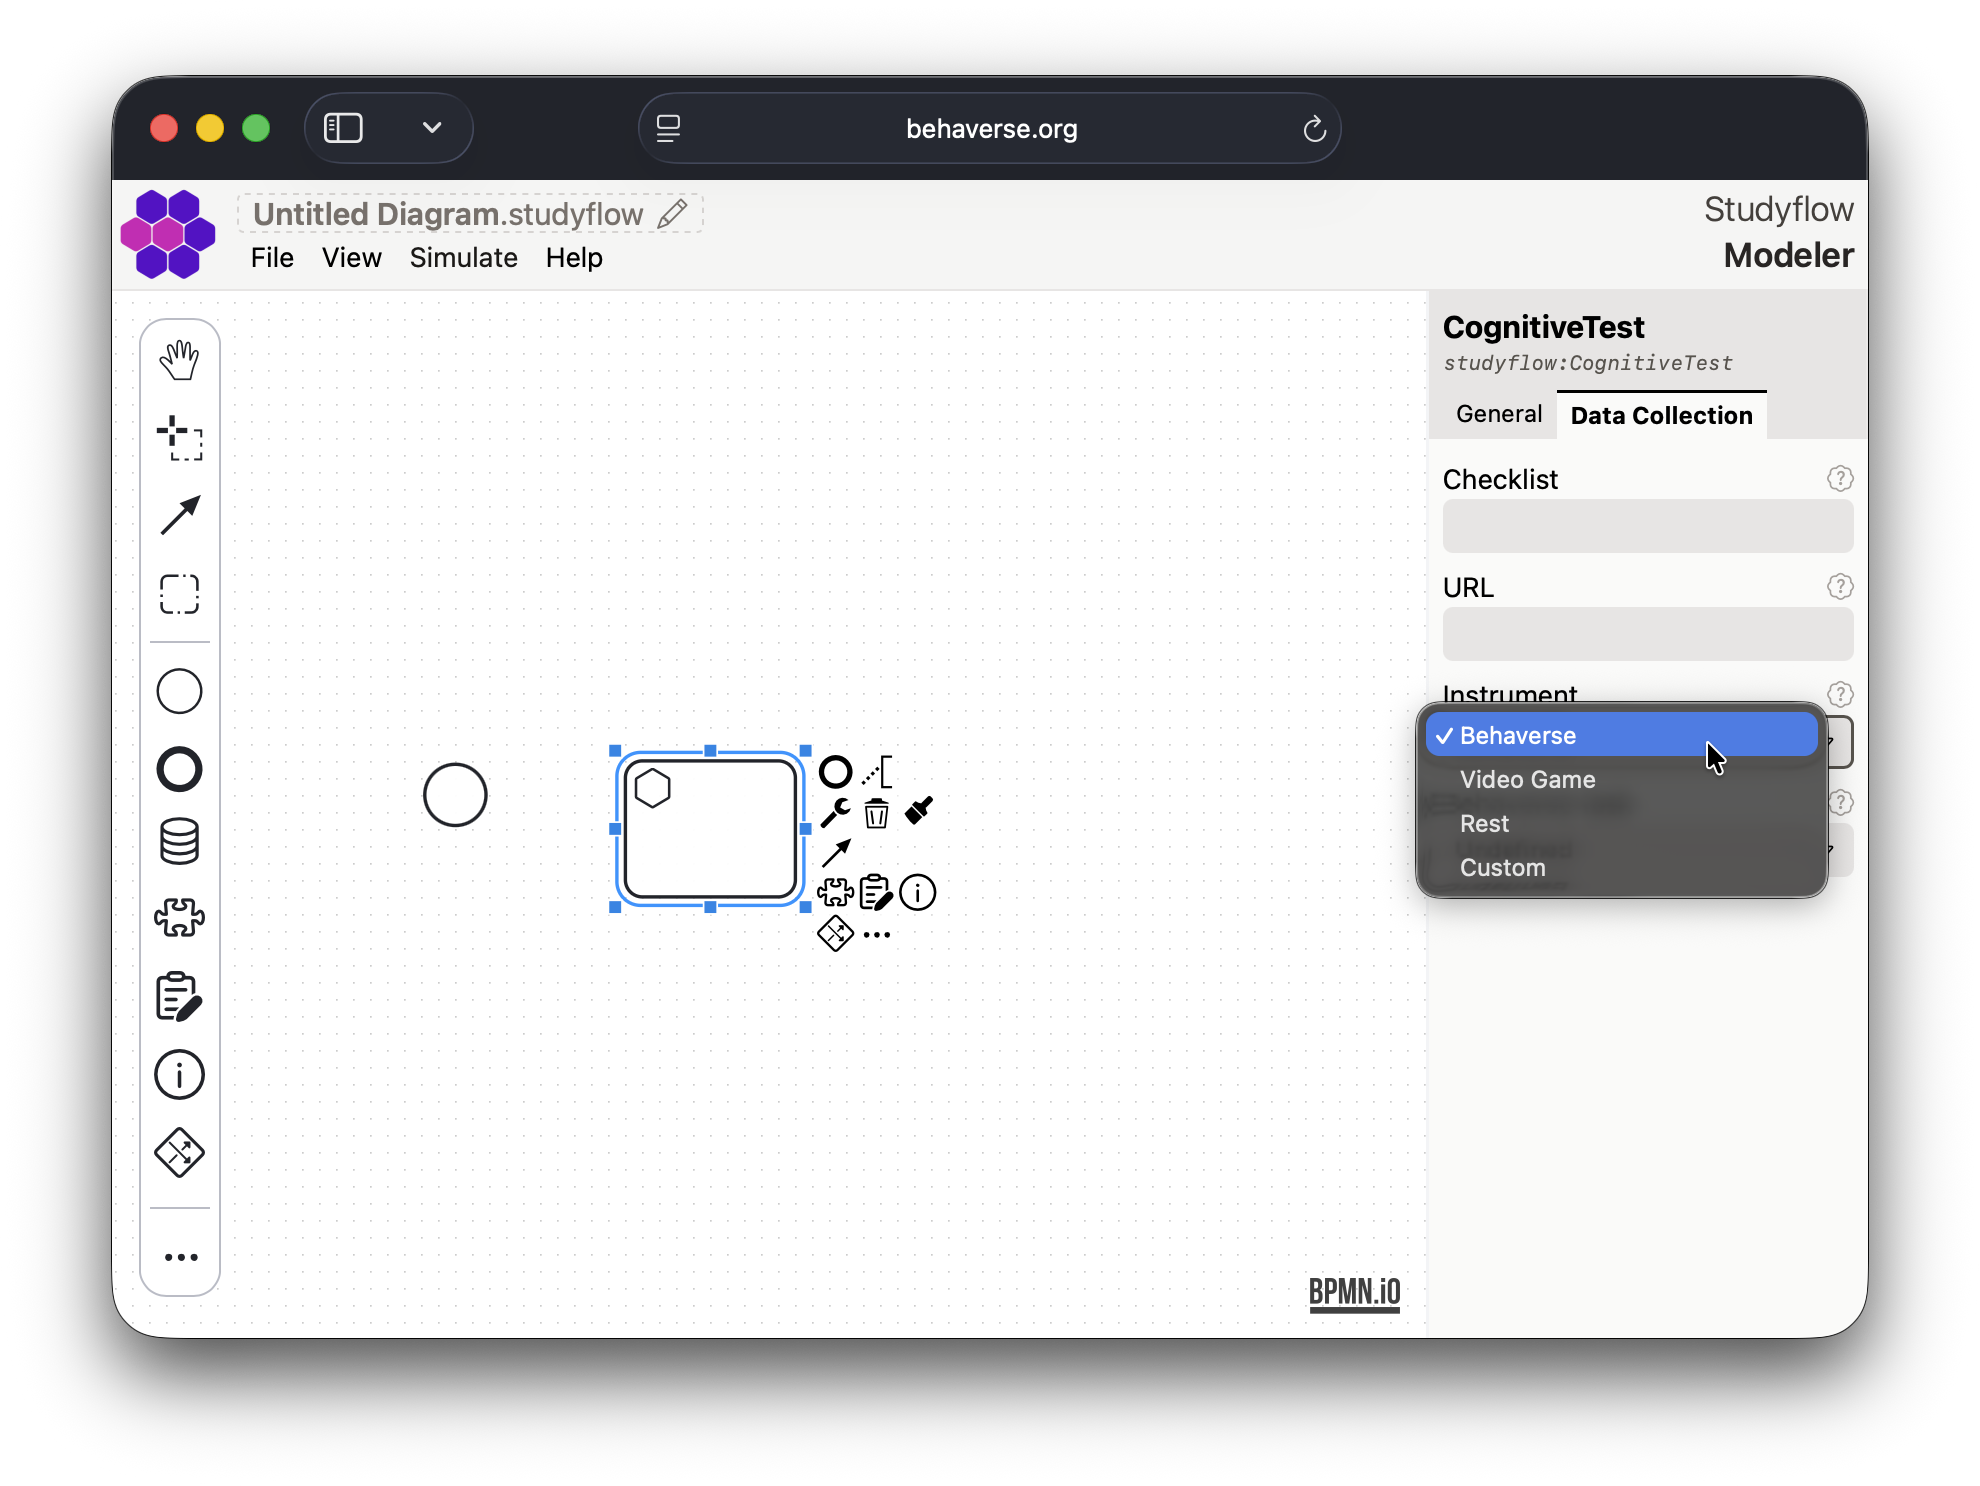
- Connect elements by selecting the connect tool in the left palette. First select the source element and then the target element. The type of the connection will depend on the selected elements.
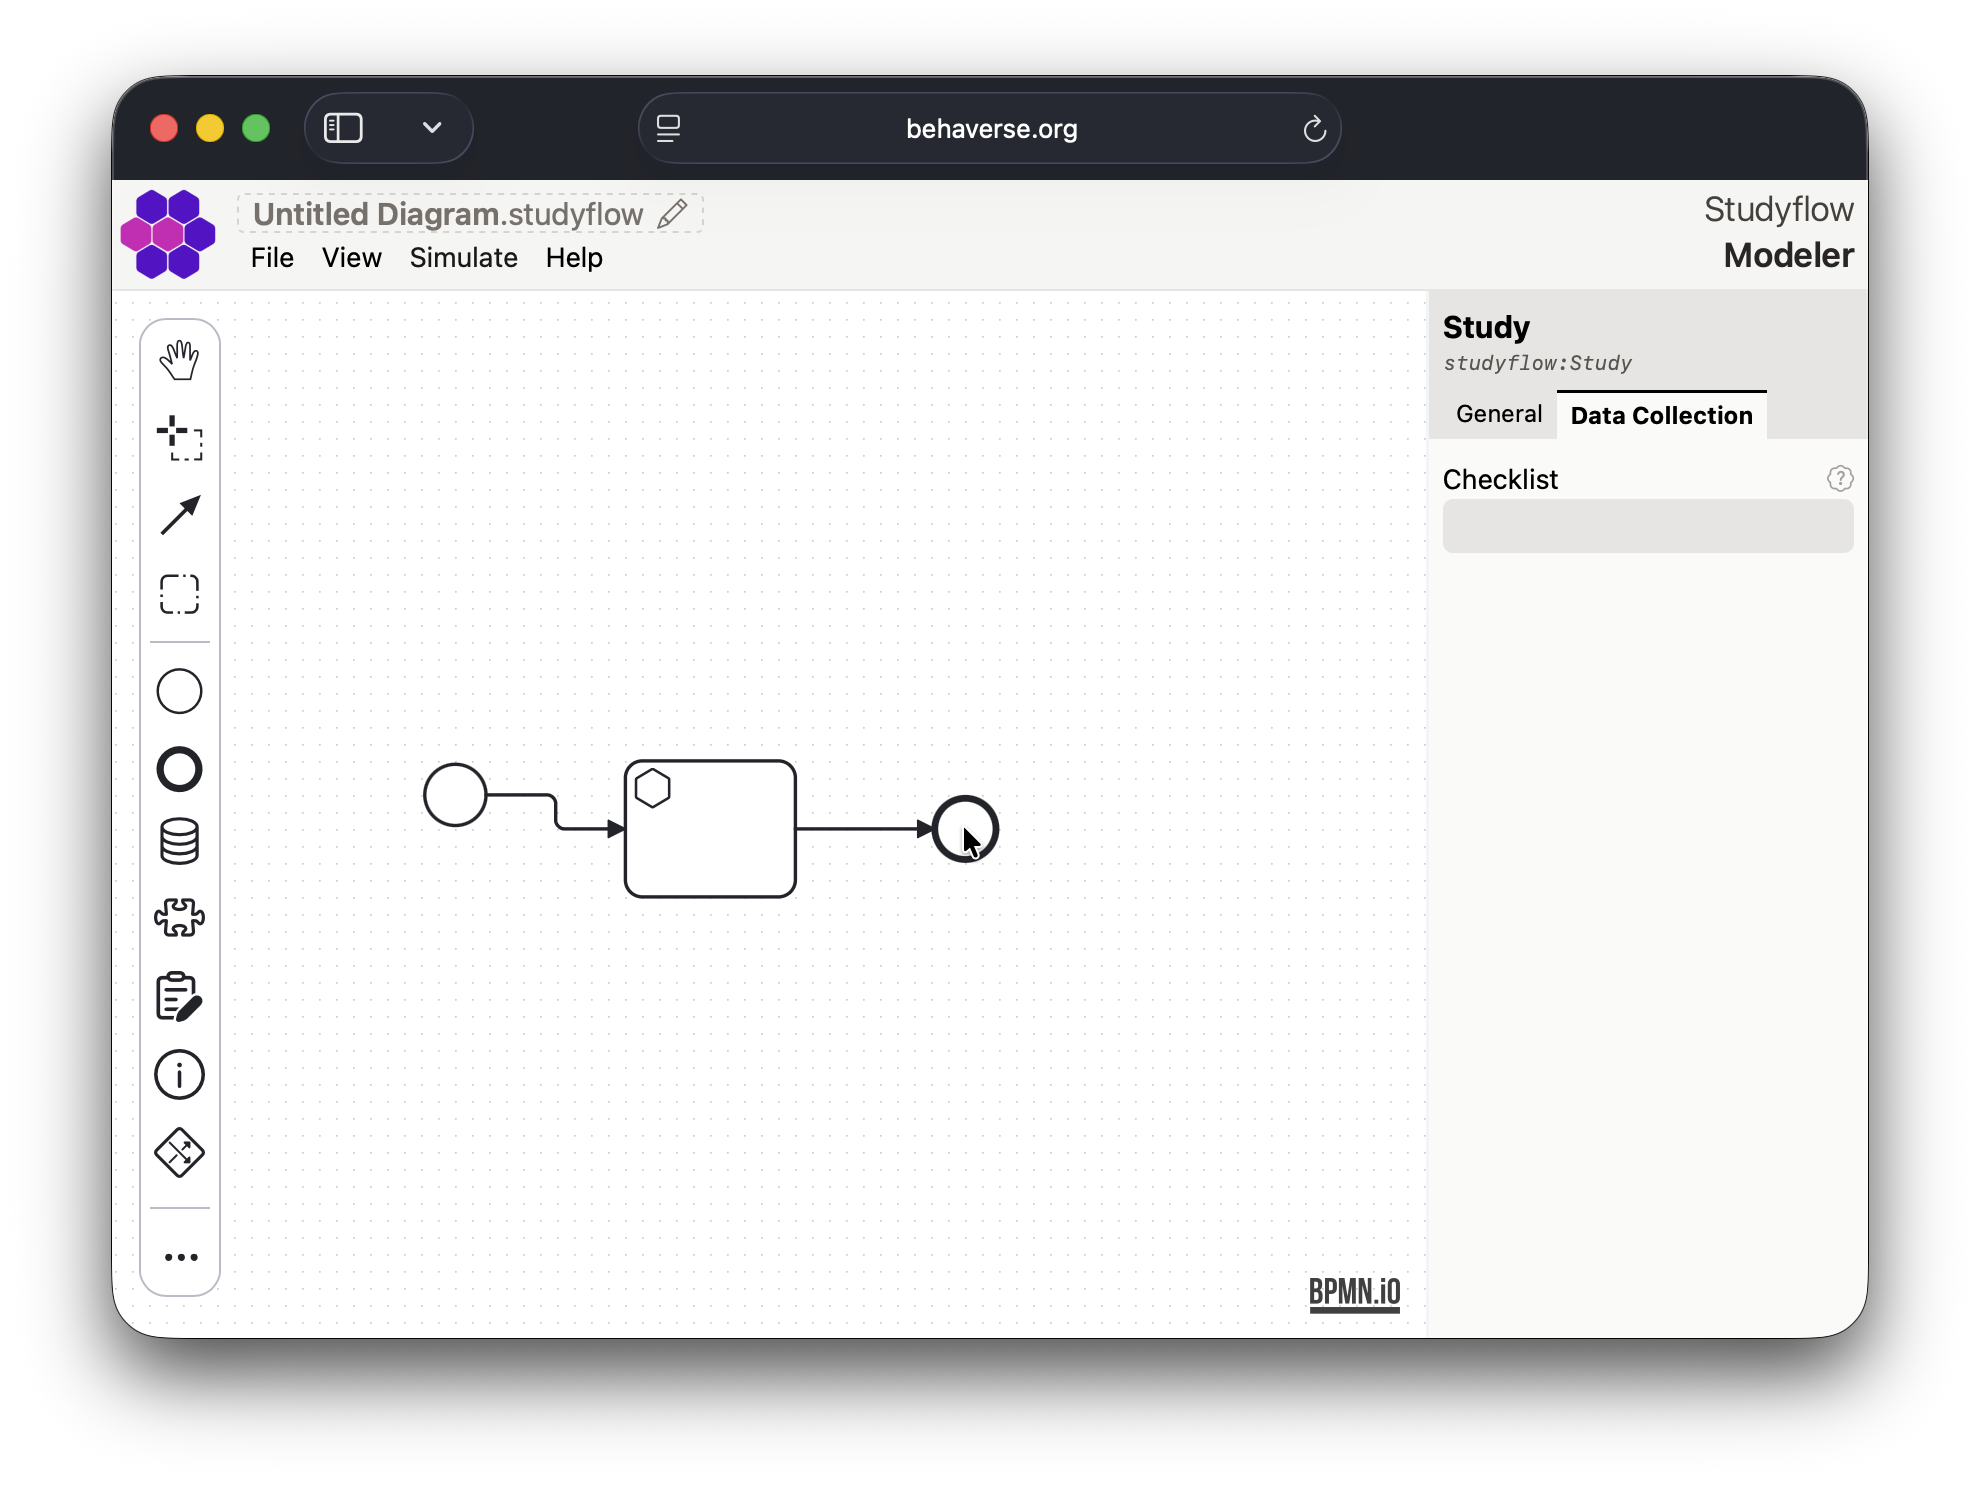
- Add additional elements and connections to complete your diagram.
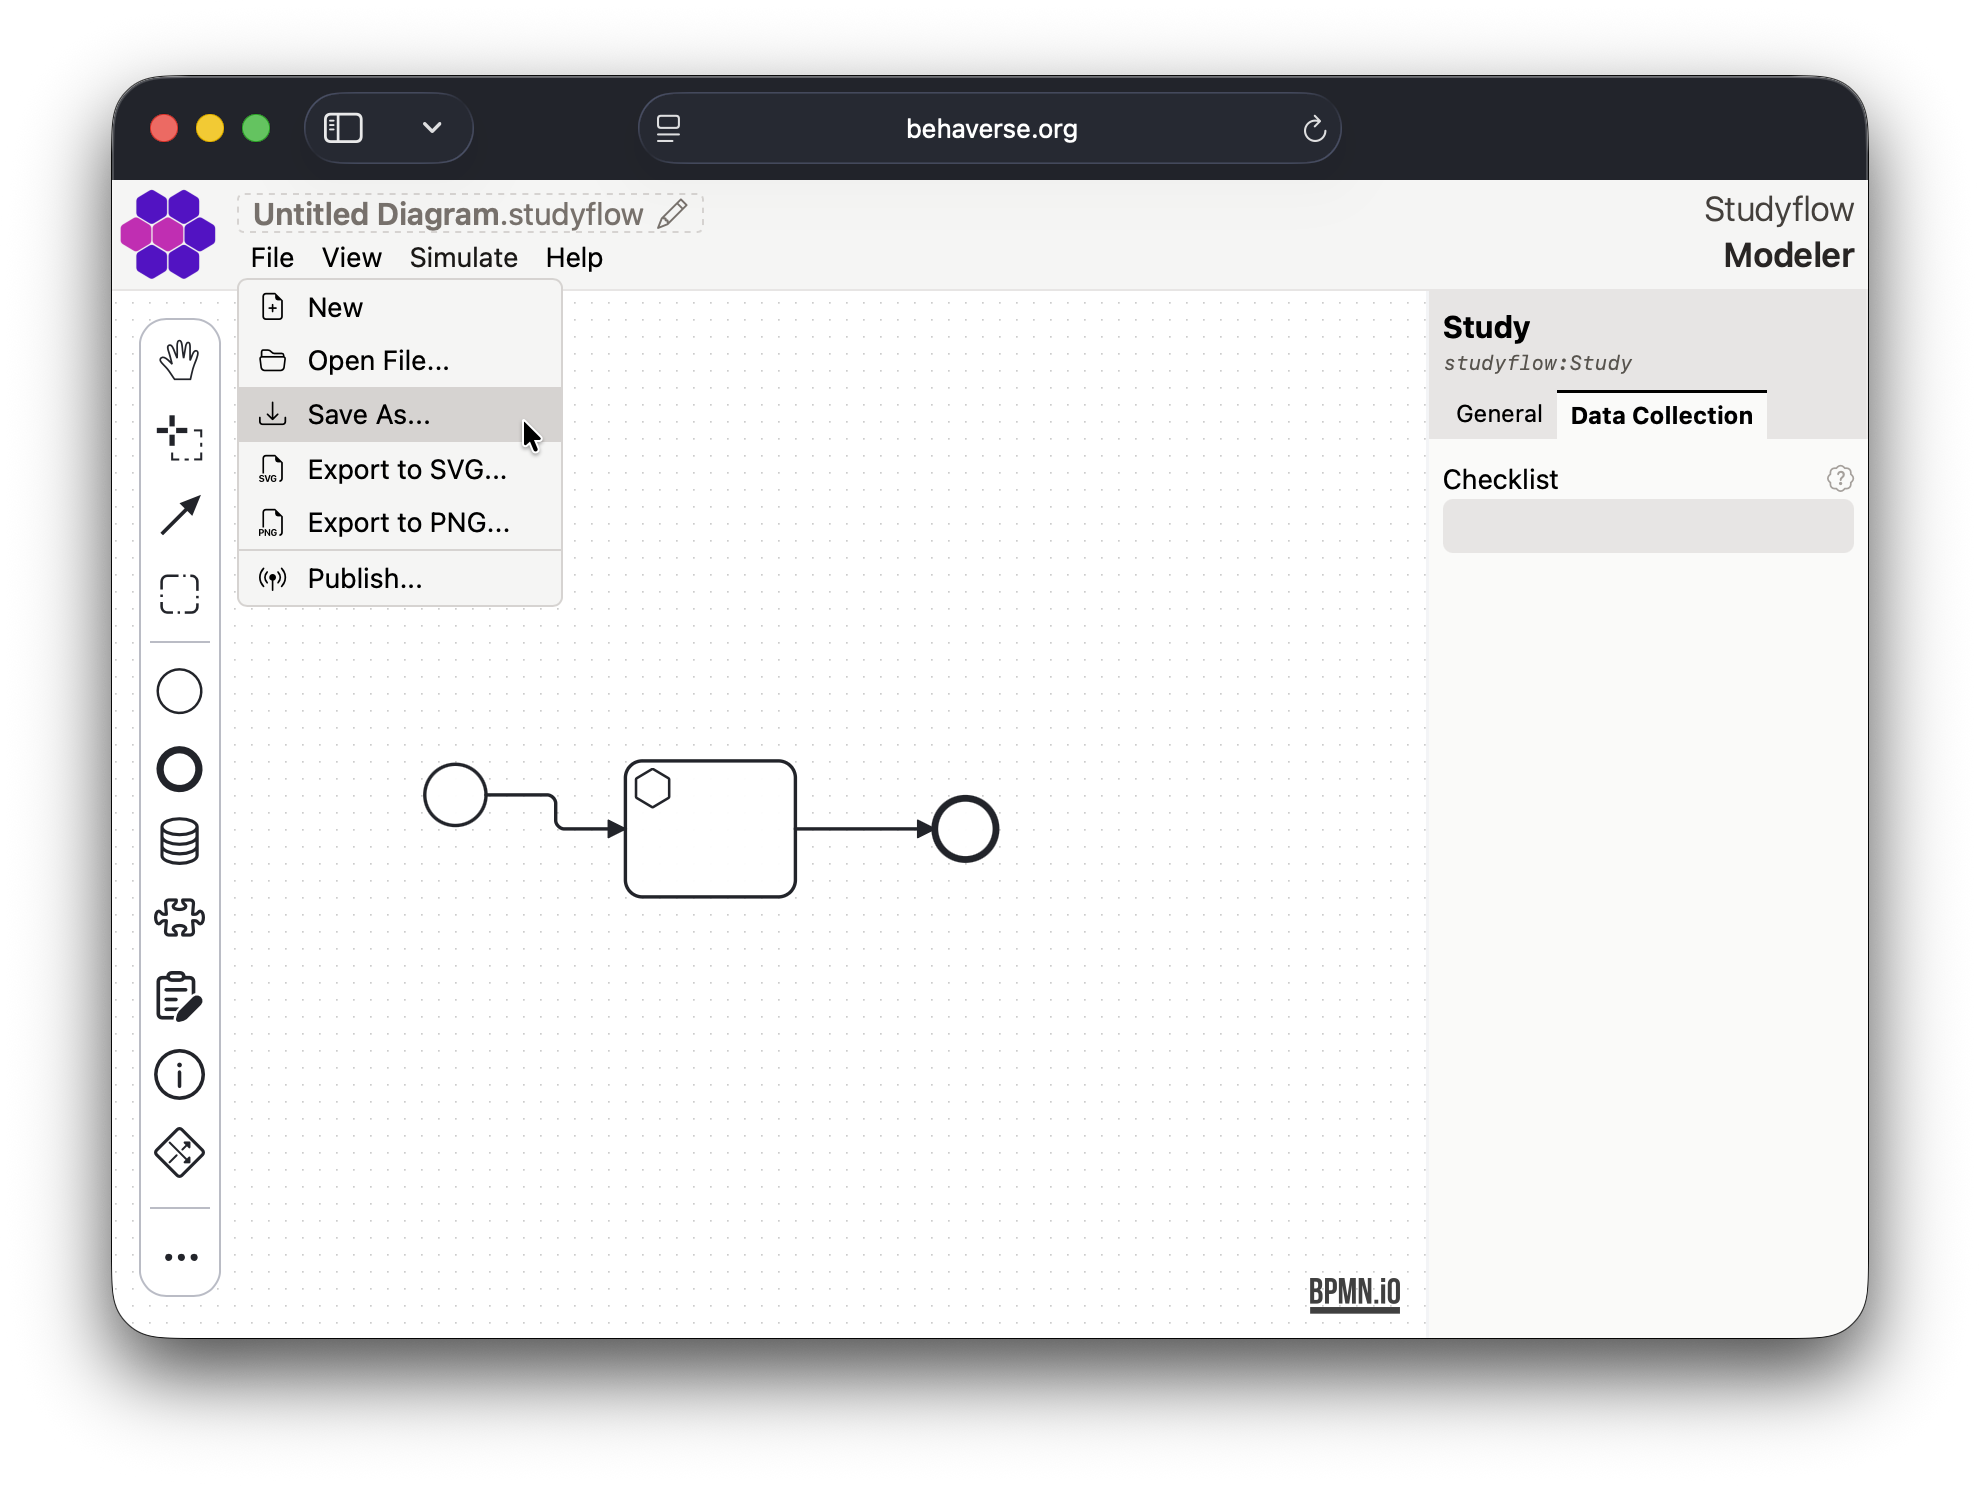
- Save your diagram using the “Save As…” option in the “File” menu: “Studyflow” writes the native YAML file (
*.studyflow) and “BPMN 2.0 XML” the interchange XML – both can be reopened in the modeler. One-way outputs live under “Export…”: images (SVG, PNG) and the metadata formats (LinkML, NIDM, ARTEM-IS).
Command palette and shortcuts
Press Cmd/Ctrl+K to open the command palette, a searchable list of every modeler action (run, file operations, exports, views, settings). While the search box is empty, common commands have single-key shortcuts:
| Key | Command |
|---|---|
| 1 | New |
| 2 | Open File |
| 3 | Save As |
| 4 | Export |
| 5 | Run |
| 6 | Settings |
| 0 | Reset Zoom |
The palette also hosts the View as Checklist and View as Gantt commands – see Views.
Autosave
The modeler can save the current diagram to the browser’s local storage as you edit, so the diagram survives reloads. Toggle this under Settings → Editor → Auto-save diagram (off or on for this browser). Autosave is local-only; use Save As… to keep a .studyflow file alongside your code and data.
Settings
The Settings view (palette shortcut 6) groups configuration into sections:
- Account – the Behaverse API key used to publish studies and record run data.
- Editor – canvas preferences and the autosave toggle.
- Extensions – the schema palette (see below).
- LLM – default provider (
claudeorollama), model, and endpoint for bot-driven tasks.
Schema palette
Element types ship in layered schemas. core and cognitive are always loaded (Behaverse assessment tasks are part of cognitive); the domain extensions – OmniProcess, DataTrove, OpenBCI – can be enabled or disabled under Settings → Extensions. Disabled schemas are excluded from the palette and not recognized when opening diagrams (reload the page to apply changes). See Extensions for what each extension provides.
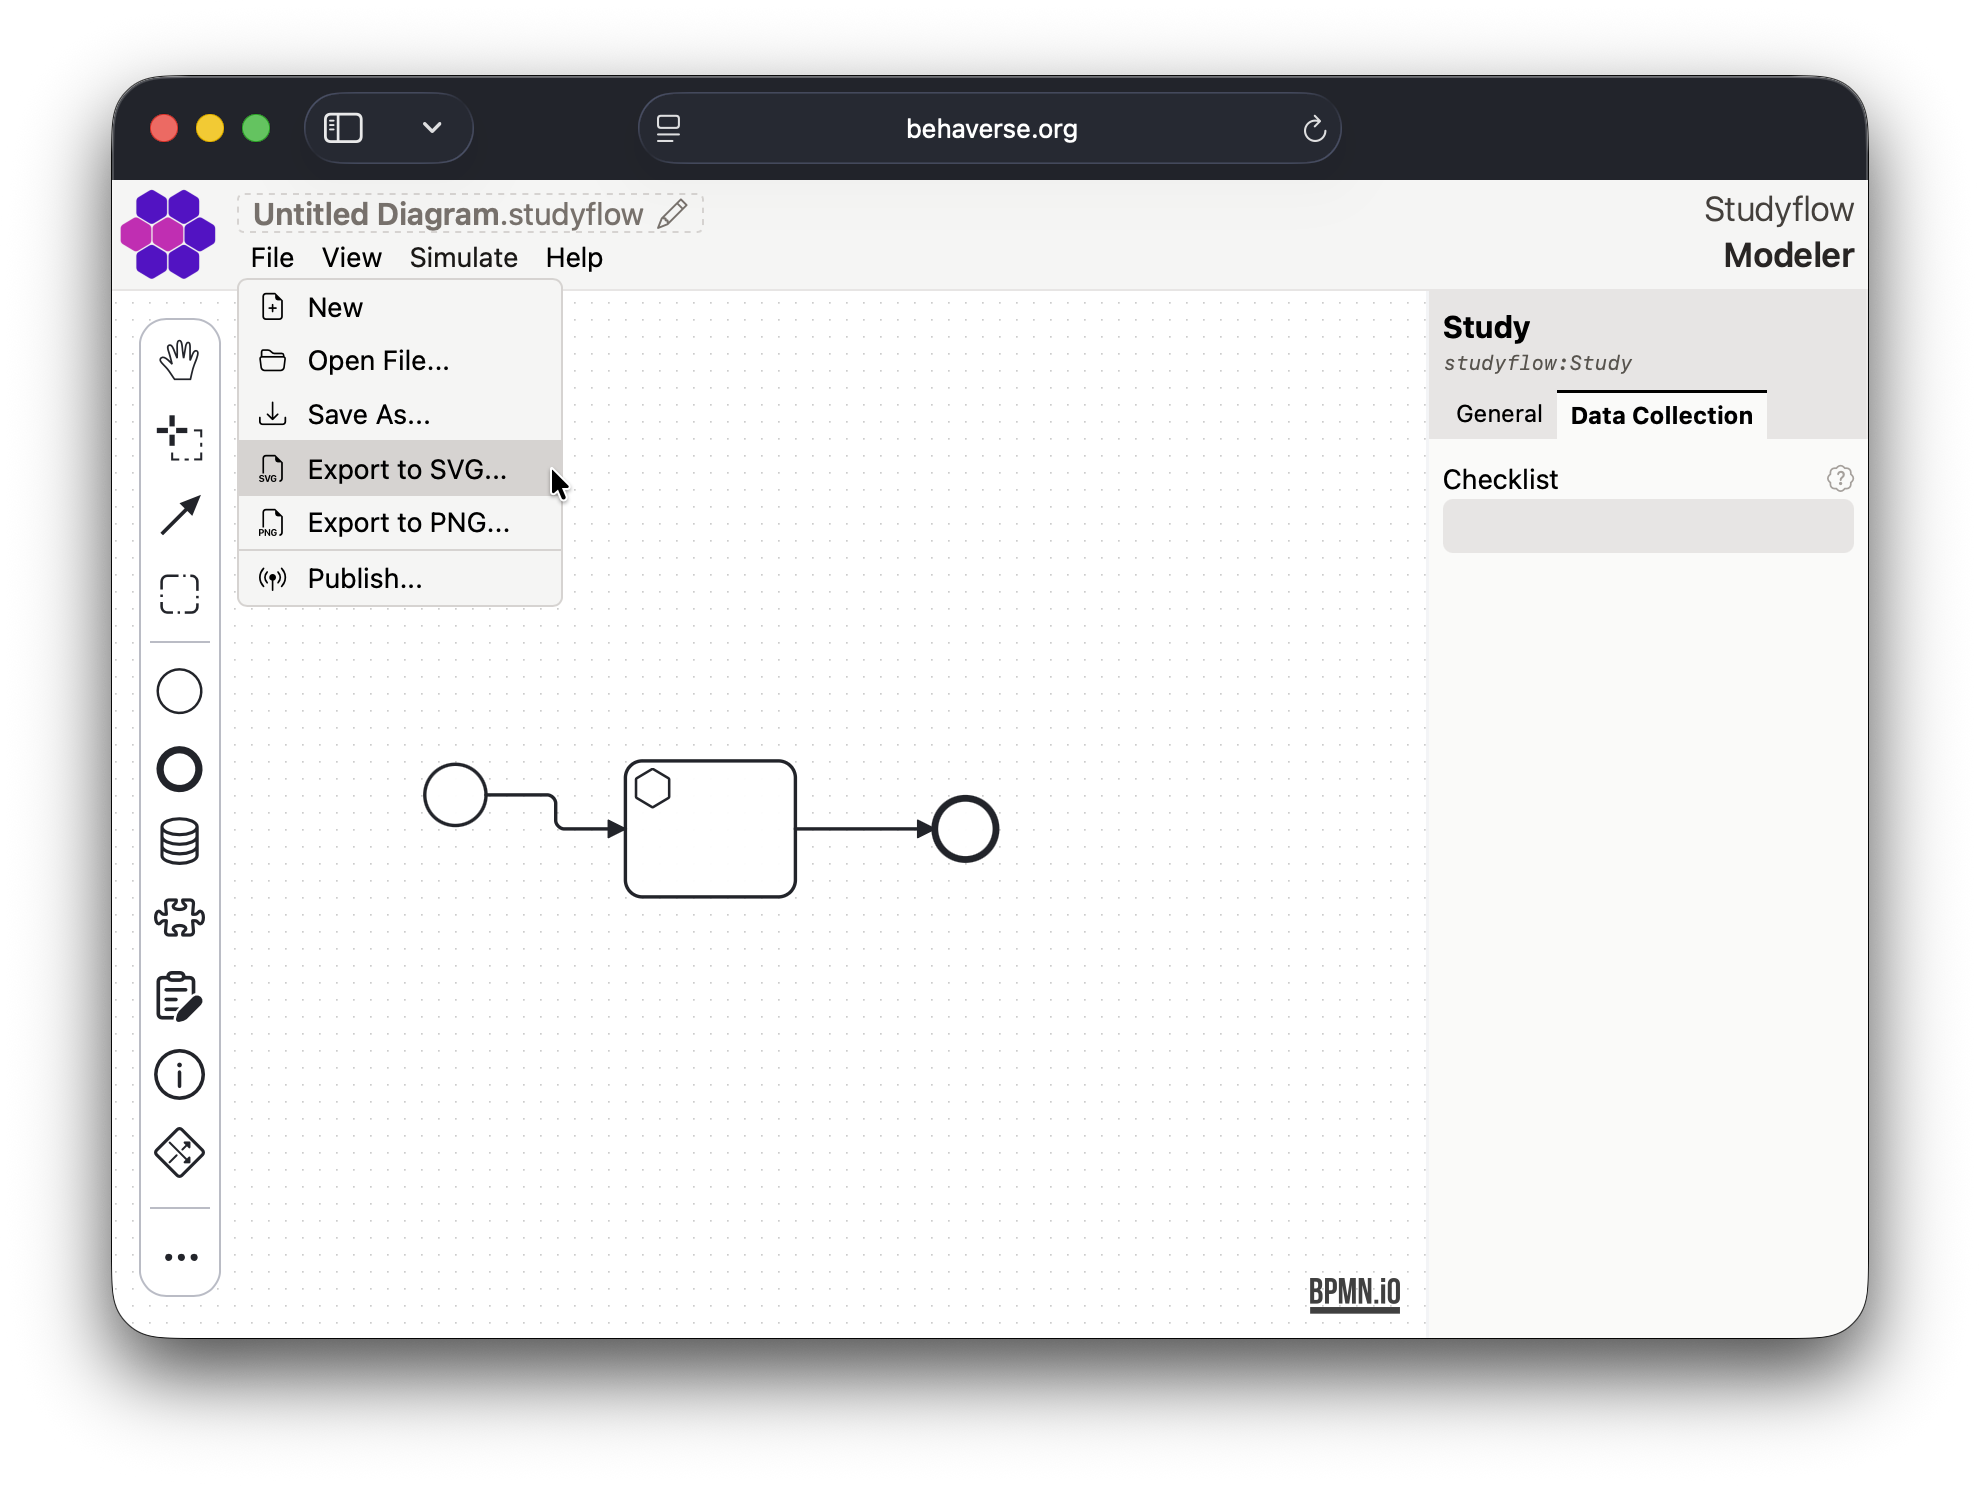
Export formats
Besides saving the .studyflow file (YAML), the modeler exports the diagram in several formats (see src/modeler/exporters/):
| Format | What it is for |
|---|---|
| BPMN 2.0 XML | The same diagram as standard BPMN XML, for interop with other BPMN tooling. |
| SVG | Vector figure of the diagram, for manuscripts and web pages. |
| PNG | Raster figure, for slides and quick sharing. |
| LinkML | The diagram’s data elements as a LinkML schema, for data engineers and validation tooling. |
| NIDM-Results (Turtle) | Analysis metadata as NIDM-Results RDF, for neuroimaging provenance tooling. |
| ARTEM-IS (JSON) | EEG methods descriptor following the ARTEM-IS template, for EEG reporting. |
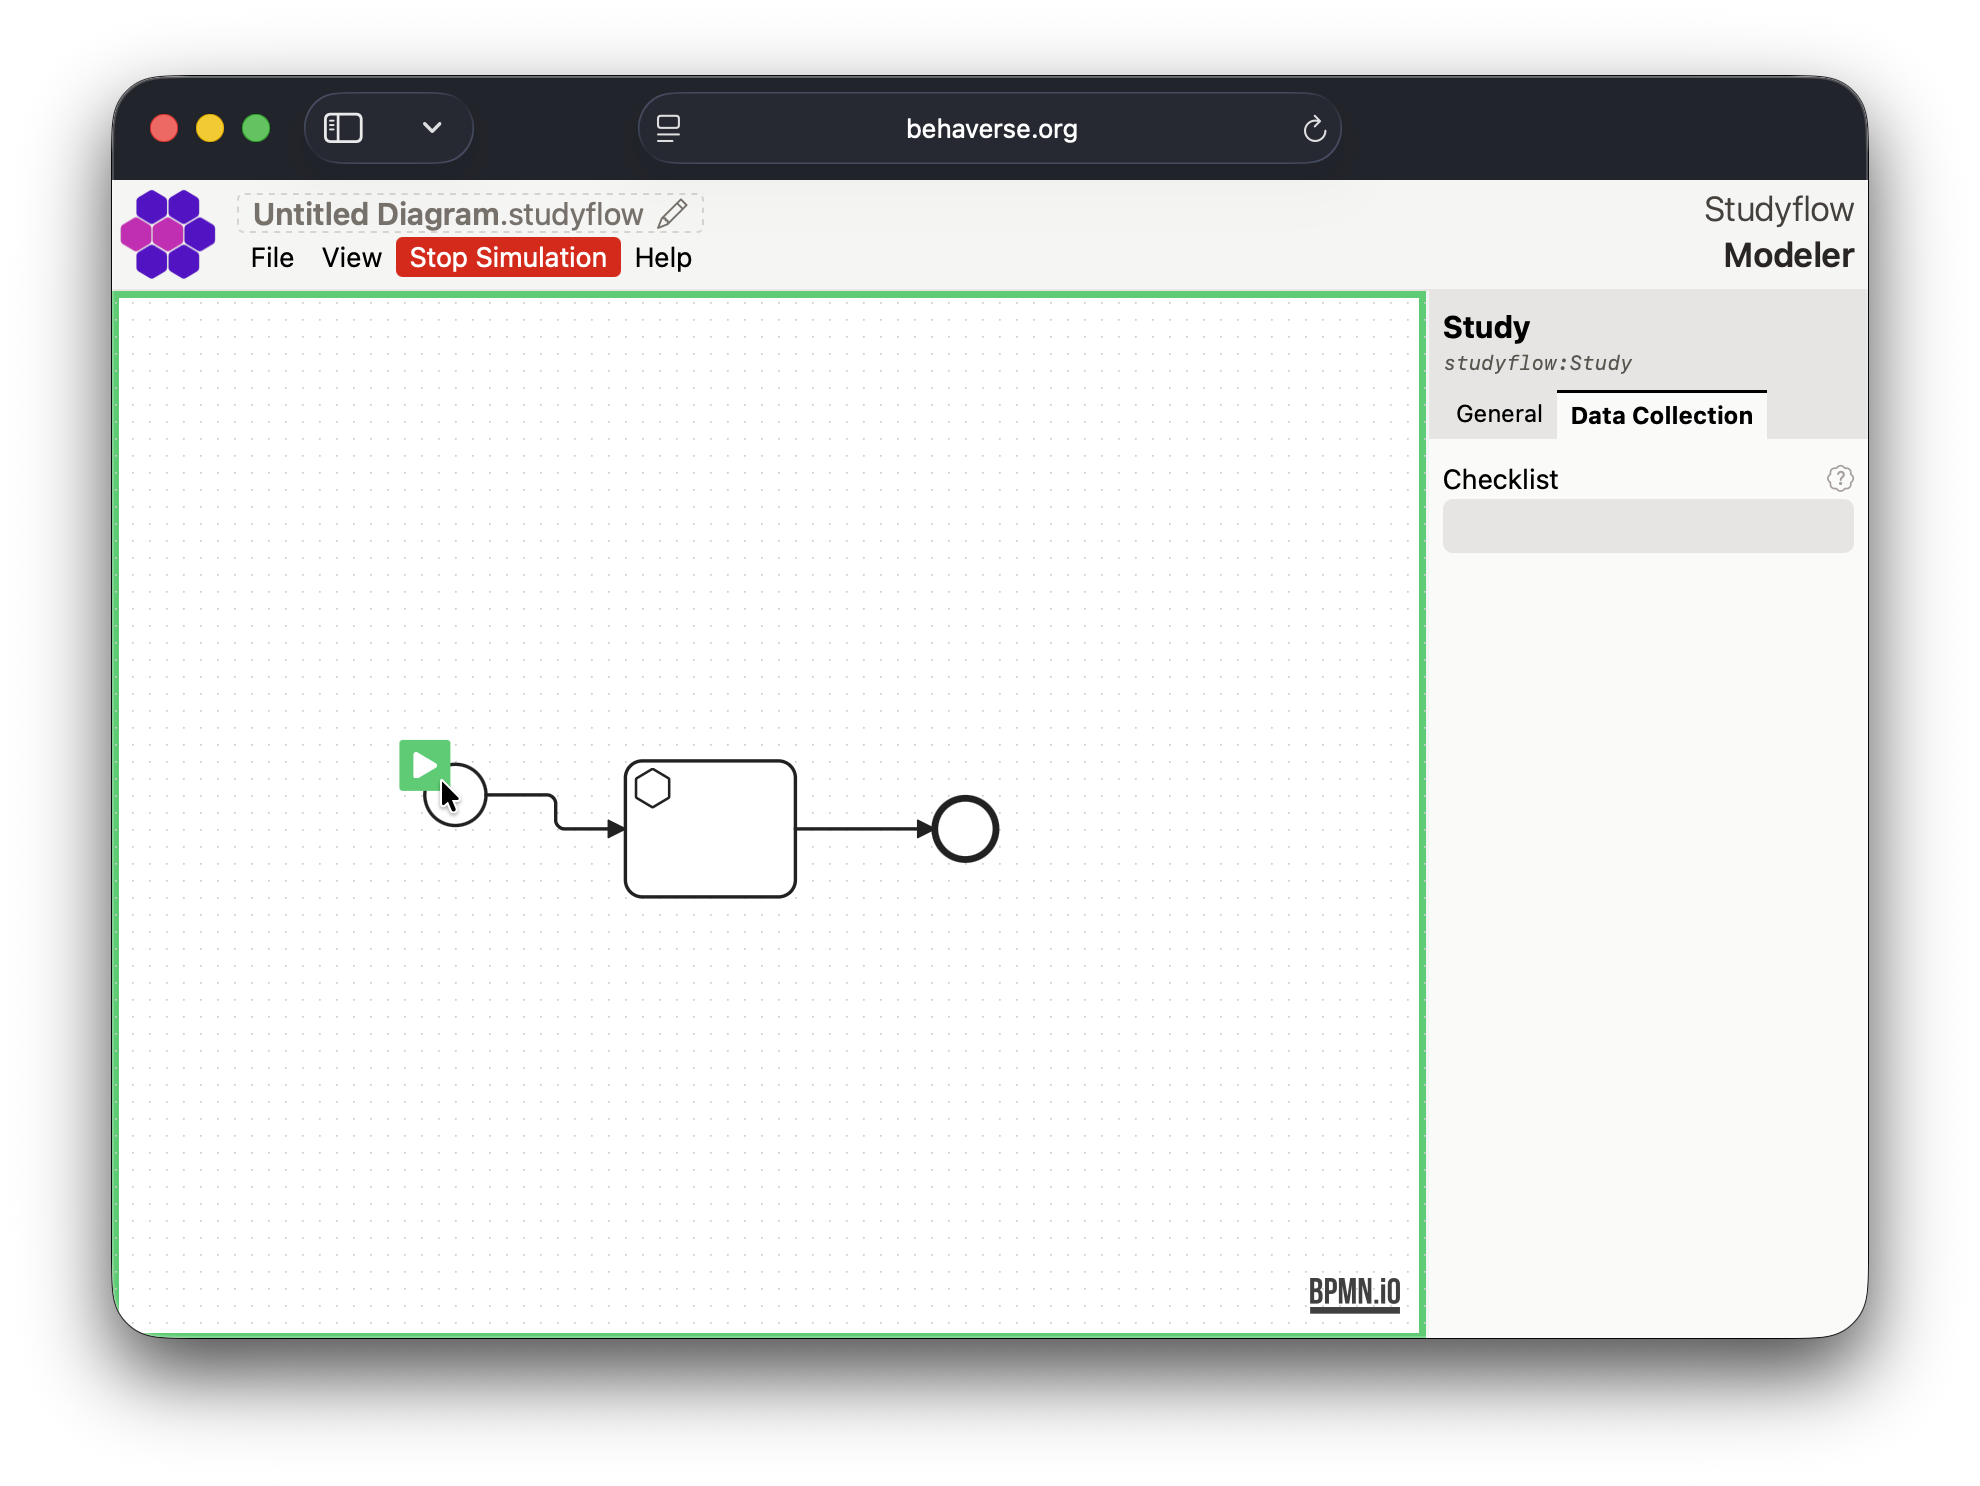
Simulation mode
Once your diagram is complete, you can test it using the simulation mode. Click the “Simulate” button in the top toolbar to start the simulation. This will allow you to interact with the studyflow as if it were running in a real study.
Publishing studies
If you have a Behaverse API key, you can publish your studyflow diagram directly to the Behaverse Data Server. Use the “Publish” option in the “File” menu to upload your diagram.
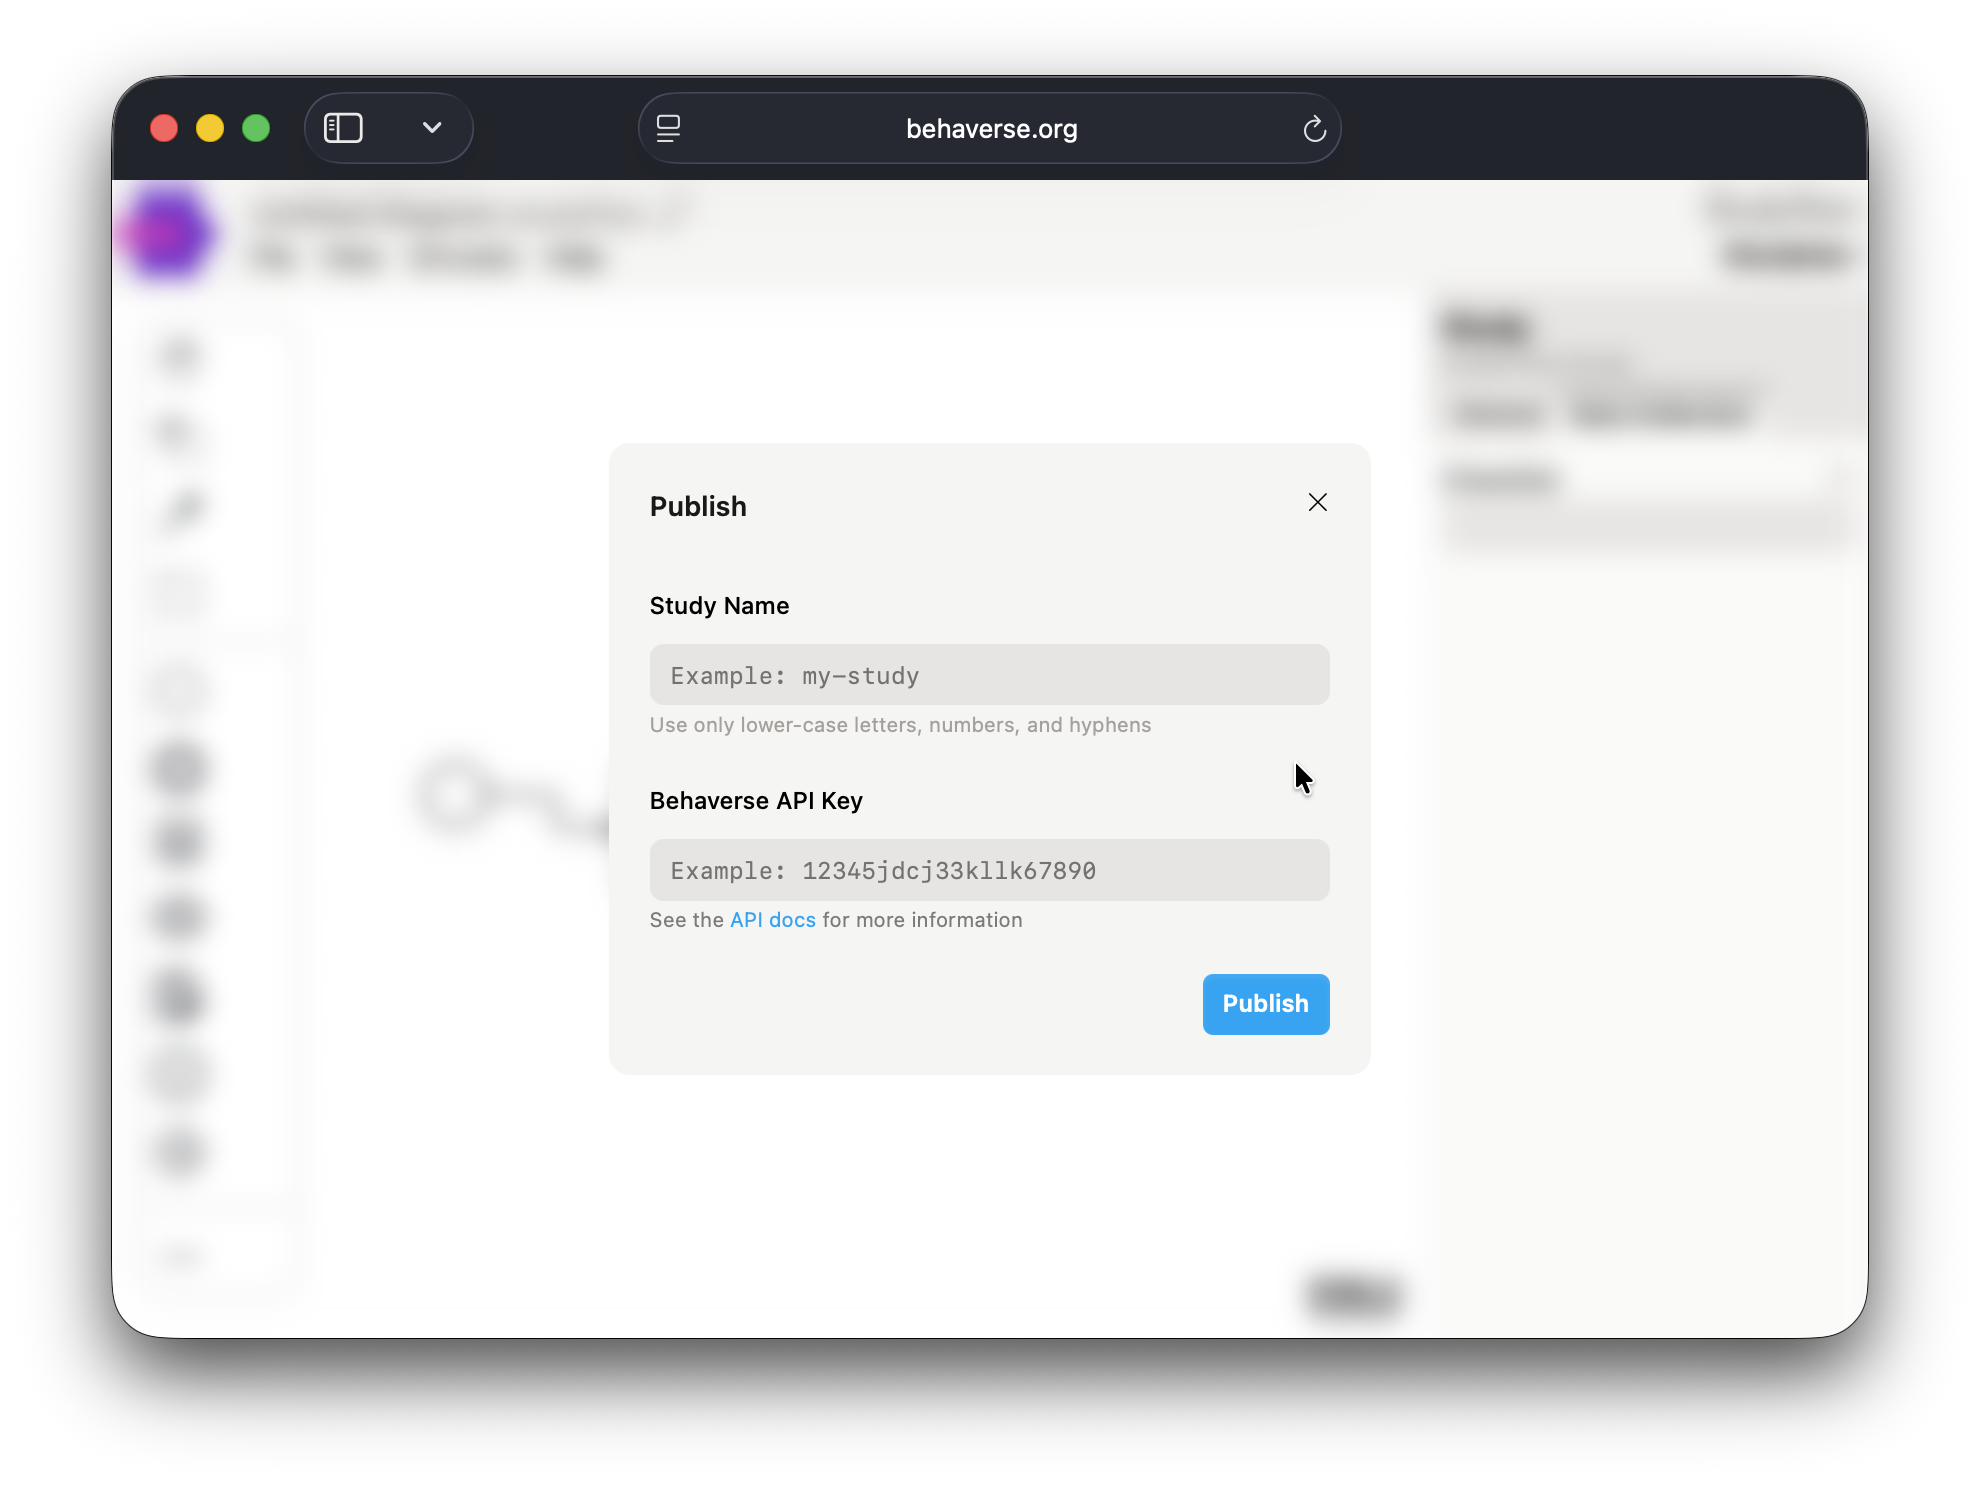
Once published, you can run the study on the Behaverse platform and collect data from participants.